Chapter 2: The Deterministic 429 Watchdog
In the previous post I explained what MCP is and how an agent decides its next move from the tools available. Now for something you could actually ship over a weekend: an MCP server that watches token consumption on your Azure OpenAI or Foundry deployment and warns you on Slack or email before the 429 lands in production.
tl;dr
- Watch Azure Monitor metrics before the client hits the first 429.
- Start with a deterministic threshold plus a rising-trend check.
- Add agent reasoning later, after the telemetry and alert path prove they work.
Why this is subtler than it looks
The first reaction from anyone who’s never been bitten by a 429 is “easy, just measure usage and compare it to the quota.” The problem is that TPM (tokens per minute) and RPM (requests per minute) on Azure OpenAI are evaluated over short rolling windows, not a smooth average across the minute. That means you can blow the limit even while staying “under quota” in aggregate, simply because requests arrived in a burst instead of spread out. That’s why teams report 429s “even within the documented limit”: the problem isn’t total volume, it’s distribution over time.
The industry-standard answer is retry with exponential backoff and jitter, reading the retry-after-ms header the API already returns. That’s necessary, but it’s reactive: the client already felt the error. What we want here is the layer before that: seeing the consumption trend climb toward the limit and acting before the first 429 ever fires.
What Azure already solves without you writing a line of code
Before building anything, though: the platform already solves a good chunk of this on its own. Azure OpenAI exposes native metrics in Azure Monitor per deployment: the real API names are TokenTransaction (processed tokens), AzureOpenAIRequests (total calls), ProcessedPromptTokens, GeneratedTokens, and the latency metrics, all filterable by the ModelDeploymentName dimension. A simple threshold alert, “warn when TokenTransaction crosses X tokens in 1 minute”, doesn’t need an agent, MCP, or any code at all. It’s an azurerm_monitor_metric_alert pointing at an azurerm_monitor_action_group with email and a Slack webhook, solved in plain Terraform:
resource "azurerm_monitor_action_group" "ia_oncall" {
  name                = "ag-ia-oncall"
  resource_group_name = azurerm_resource_group.ia.name
  short_name          = "iaoncall"

  email_receiver {
    name          = "sre-team"
    email_address = "sre-ai@yourcompany.com"
  }

  webhook_receiver {
    name        = "slack-webhook"
    service_uri = var.slack_webhook_url
  }
}

resource "azurerm_monitor_metric_alert" "tpm_80pct" {
  name                = "alert-tpm-80pct-gpt4o"
  resource_group_name = azurerm_resource_group.ia.name
  scopes              = [azurerm_cognitive_account.openai.id]
  description         = "TokenTransaction crossed 80% of configured TPM on the gpt-4o-prod deployment"
  severity            = 2
  frequency           = "PT1M"
  window_size         = "PT1M"

  criteria {
    metric_namespace = "Microsoft.CognitiveServices/accounts"
    metric_name      = "TokenTransaction"
    aggregation      = "Total"
    operator         = "GreaterThan"
    threshold        = 200000 # 80% of a 250k TPM deployment; adjust to your limit

    dimension {
      name     = "ModelDeploymentName"
      operator = "Include"
      values   = ["gpt-4o-prod"]
    }
  }

  action {
    action_group_id = azurerm_monitor_action_group.ia_oncall.id
  }
}
That alone already covers the most common case, with no agent, no MCP, no code to maintain. The full Terraform, including the azurerm_cognitive_account and azurerm_cognitive_deployment referenced above, is in the series companion repo.
The reason to build the MCP server on top of that alert is what the native rule still does not do. It fires when the threshold is crossed, but it does not look at the slope of the curve, compare the spike with the usual pattern for that hour, or roll TPM, RPM, and error rate into one message with context. That part still needs code.
The architecture
The server exposes a deliberately small set of tools, split into two groups that don’t mix: telemetry reads and notifications. No tool with the power to act on the resource itself: nothing that bumps quota or redistributes traffic on its own. That’s intentional, and I’ll explain why further down.
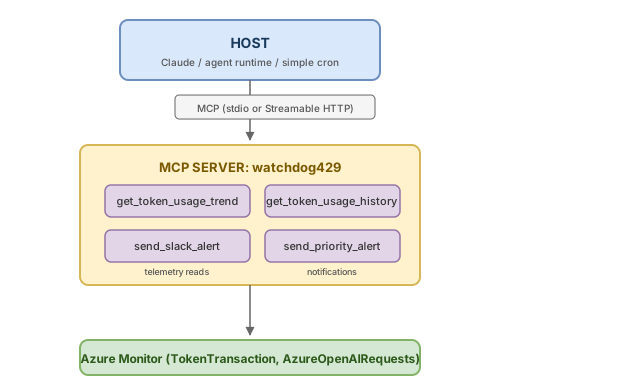
The central tool is get_token_usage_trend. It queries the Azure Monitor metrics API for the Azure OpenAI resource via the official azure-monitor-query package (MetricsQueryClient), pulls TokenTransaction over a short window (say, the last 5 minutes in 1-minute buckets, filtered by ModelDeploymentName), and returns the percentage of configured TPM already consumed, along with the slope of the curve: not just “how much,” but “how fast it’s climbing.”
# pip install mcp azure-monitor-query azure-identity httpx
import os
import httpx
from datetime import timedelta
from mcp.server.fastmcp import FastMCP
from azure.monitor.query import MetricsQueryClient
from azure.identity import DefaultAzureCredential

mcp = FastMCP("watchdog429")
metrics_client = MetricsQueryClient(DefaultAzureCredential())
OPENAI_RESOURCE_ID = os.environ["OPENAI_RESOURCE_ID"]

@mcp.tool()
def get_token_usage_trend(deployment_name: str, window_minutes: int = 5) -> dict:
    """Returns the current 1-minute TPM usage for the deployment plus a simple
    trend over the last N minutes. Uses the native TokenTransaction metric,
    filtered by the ModelDeploymentName dimension. Performs no action on the
    deployment itself."""
    response = metrics_client.query_resource(
        resource_uri=OPENAI_RESOURCE_ID,
        metric_names=["TokenTransaction"],
        timespan=timedelta(minutes=window_minutes),
        granularity=timedelta(minutes=1),
        filter=f"ModelDeploymentName eq '{deployment_name}'",
    )
    series = [p.total or 0 for p in response.metrics[0].timeseries[0].data]
    if not series:
        return {
            "deployment_name": deployment_name,
            "current_tpm": 0,
            "pct_of_tpm": 0,
            "trend": "no_data",
            "window_minutes": window_minutes,
        }

    tpm_limit = get_configured_tpm(deployment_name)  # from Terraform or inventory
    current_tpm = series[-1]
    previous_tpm = series[-2] if len(series) > 1 else series[-1]

    if current_tpm > previous_tpm:
        trend = "rising"
    elif current_tpm < previous_tpm:
        trend = "falling"
    else:
        trend = "stable"

    return {
        "deployment_name": deployment_name,
        "current_tpm": current_tpm,
        "pct_of_tpm": current_tpm / tpm_limit,
        "trend": trend,
        "window_minutes": window_minutes,
    }

if __name__ == "__main__":
    mcp.run(transport="stdio")
Note:
get_configured_tpm()is a placeholder. In practice, retrieve the TPM limit from your Terraform state, a configuration file, or the Azure API. The implementation depends on how your organization tracks deployment quotas.
And the notification tool is deliberately dumb: it doesn’t decide anything, it just sends what it’s told to:
@mcp.tool()
def send_slack_alert(message: str) -> str:
    """Posts a message to the preconfigured Slack webhook. It does not decide
    when to alert or what the message should say."""
    httpx.post(SLACK_WEBHOOK_URL, json={"text": message}, timeout=10).raise_for_status()
    return "sent"
The simplest version that already works
For this post, the “agent” can start as a script on a one-minute schedule, with no LLM in the loop at all: call get_token_usage_trend, and if pct_of_tpm > 0.8, call send_slack_alert. That already solves most of the practical problem, and it is what I would ship first. Before you put a model in charge, prove that the telemetry and the alert path actually work.
trend = get_token_usage_trend("gpt-4o-prod", window_minutes=5)
if trend["pct_of_tpm"] > 0.8 and trend["trend"] == "rising":
    send_slack_alert(f"Deployment gpt-4o-prod at {trend['pct_of_tpm']:.0%} of TPM and rising")
Notice that this does not even need a real MCP host yet. It is just a script calling the same functions the server exposes. Packaging it as MCP starts paying off later, when you want a broader operations agent, including the AKS one from the previous post, to consume the same telemetry without a fresh integration every time.
Where this gets interesting (and where it gets dangerous)
The fixed-threshold version (80%, 90%, whatever) has a classic monitoring problem: it can’t tell a legitimate end-of-month spike, such as a batch job that always eats 90% of quota for 10 minutes and then returns to normal, from some agent loose somewhere in your environment looping and burning tokens nonstop, which is exactly the scenario from the previous post. Both cross the same threshold; only one of them deserves a page.
That’s where the next piece of the series comes in: giving the monitor a reasoning layer instead of a fixed if, so it can compare the current pattern against recent history before deciding between “heads-up on Slack” and “an actual page.” That’s the subject of the next post: moving from a deterministic script to an agent that actually decides, with the right guardrails so that decision doesn’t get out of hand.
For now, the most important guardrail is already in the design: the server only reads telemetry and only writes to notification channels. It doesn’t have, and shouldn’t have, any tool capable of changing quota, redistributing traffic across regions, or restarting a deployment. Before this agent gets any power to act on the resource, it needs to first prove, in production, that it can tell noise from signal. That’s post 3.
What I would ship first
If you want to test the pure-script version before you even touch MCP, it really is just the two functions above and a one-minute schedule. Start there. The next step is teaching the watchdog to tell a normal spike from a bad one without giving it the power to change anything in production.
Companion repository: agentic-infra-handbook
What can go wrong
- Stale TPM configuration — If
get_configured_tpm()returns an outdated limit (e.g., the deployment was scaled up but the config wasn’t updated), the watchdog will calculate the wrong percentage and either miss real spikes or cry wolf. - Metric ingestion lag — Azure Monitor metrics have roughly 1-minute ingestion delay. The watchdog may detect a spike after the 429 has already hit production. This is a layer of defense, not a guarantee.
- False-positive bursts — A legitimate short burst (e.g., a CI/CD pipeline running integration tests) can cross the threshold for a few minutes and trigger unnecessary alerts. The next post addresses this with historical comparison.
- Webhook failure — If the Slack webhook URL becomes invalid or the endpoint is down,
send_slack_alertfails silently (or throws). Add a dead-letter mechanism or a secondary notification channel. - Clock and timezone drift — If the cron schedule and the Azure Monitor metric timestamps are not aligned to UTC, the trend calculation can produce incorrect slopes.
Estimated operational cost
The once-a-minute cron on Azure Container Apps Jobs costs very little: a Python container that runs for 1-2 seconds per invocation. At Container Apps consumption pricing, expect roughly $2-5/month. The Azure Monitor metric queries are free for the first 1,000 API calls/month. The Slack webhook is free. The dominant cost is the Azure OpenAI deployment itself, not the watchdog monitoring it.
Series navigation
- MCP and agents 101 for infra engineers
- Building a deterministic 429 watchdog ← you are here
- From script to agent: giving the watchdog decision autonomy
- Multi-agent orchestration: correlating AKS and Azure OpenAI
- Agent governance on Microsoft Foundry
Further reading
Leia este post em Português.